How to conduct user interviews

A user interview is a semi-structured interview method generally used in the exploration stage of a project. Understanding potential users, their daily lives, and most importantly the context of goals and motivations of potential users are essential discovery areas for the researcher. 

What should I prepare for a user interview?

First, you can start by writing down what you’re trying to understand with the research, and the specific points you should understand deeply. 

Let’s say you’re conducting research to enhance the user experience of a call center intranet, and you have to understand the main purpose of using the call center interfaces, but can’t directly ask the participant this question. Instead, you can prepare your questions by providing a context.

  • “How do you start your conversation with the clients, and which screens are you using while you talk with them?” 
  • “Can you show me the process of mentioning critical parts and why they are so critical for you?”
  • “Now conversely, please think of, and tell me about a particular time when you used the tool, and it made you ineffective in your work.”
  • “Can you show me the process that made your call ineffective?”  

These questions are more appropriate for user interviews because they provide a context and ask participants a process they regularly do and think about.

Review your prepared questions before the interview process. Make sure to conduct a pilot interview with one of your teammates and test the questions. 

Why is a user interview important?

We need to understand our users, and the first thing to understand people is to empathize with them. Interviews provide a context to understand and evaluate the problems of the users. We can learn about the problems and challenges they’re facing directly from them. Therefore, we need to ask the right open-ended questions and listen to them.       

Moreover, user interviews are a rich source of information to feed personas and further research that is going to be carried out after the discovery phase. For example, in usability testing, we ask follow-up questions to the user to understand the motivation behind their actions or to understand the dominant emotion in the experience. We select the participants from different personas for usability testing, and the user interviews that we conducted in the discovery phase become very beneficial at this point.

How long should qualitative interviews last?

A user interview generally takes 30 minutes to 1 hour. As we can understand from the name, we don’t have a strict time limit to finish the interview. As long as the interview is fruitful, the researcher can extend the time according to the daily schedule.

How many user interviews should you do?

What are you researching, and which context are you researching for? Some researches should have a wider sampling size due to having a larger number of user profiles. According to the NN group, you should make at least 5 user interviews. One of the leading resources the NN group states that after 5 interviews the findings start to repeat itself. So we can safely assume that if there is nothing “extraordinary”, 5 interviews are enough to analyze the patterns of the users’ behavior. As a researcher, if you can’t find any patterns that are repeating itself, maybe you can add new interviews to your schedule.

As much as you practice research your empathy skills and also interview skills will improve. User interviews are the fastest way to learn about users’ motivations and pain points. You can also learn about the potential users and the contexts they seek. It’s important to inform the participants about the research you do and prepare the right questions to provide accurate and reliable data.

As the VP of NN Group says;

UX without users isn’t UX.

Hoa Loranger

5 Google Analytics tips to improve user experience

Time is one of our most valuable resources. And these user insights are not just about user experience. It provides indispensable data for startups, business owners, and marketers about user intent and how to optimize their digital products by addressing the most critical user pain points.

Based on practical ways; we will explain how to optimize your product for your users, share how to utilize Google Analytics to understand your users, and how to improve your product’s user experience with the following recommendations.

Ready?

Let’s start!

1. Site search insights

The “Site Search” section in Google Analytics can recognize significant areas of opportunity. The tool records that users composed into their own site searches. 

People who search for content or items on your site are more likely to consume that content or buy a product if they can find it on the first page of search results.

So these keywords from the behavior section in Google Analytics are telling you exactly what your users are looking for.

It means this is the GOLD.

In this section, we first need to recognize the following these:

  • Search Term: These are the words that users type into the search field on your website.
  • Start Page: These are the pages that your users start searching for.

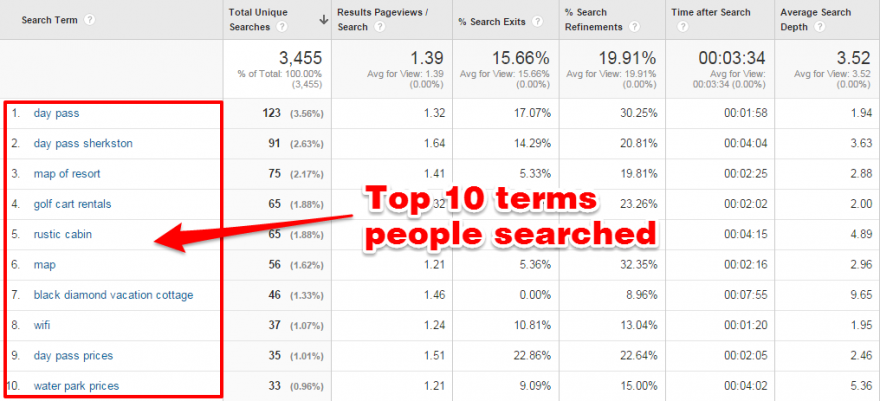
This action lets you see a list of the search terms from your users that visited your website.

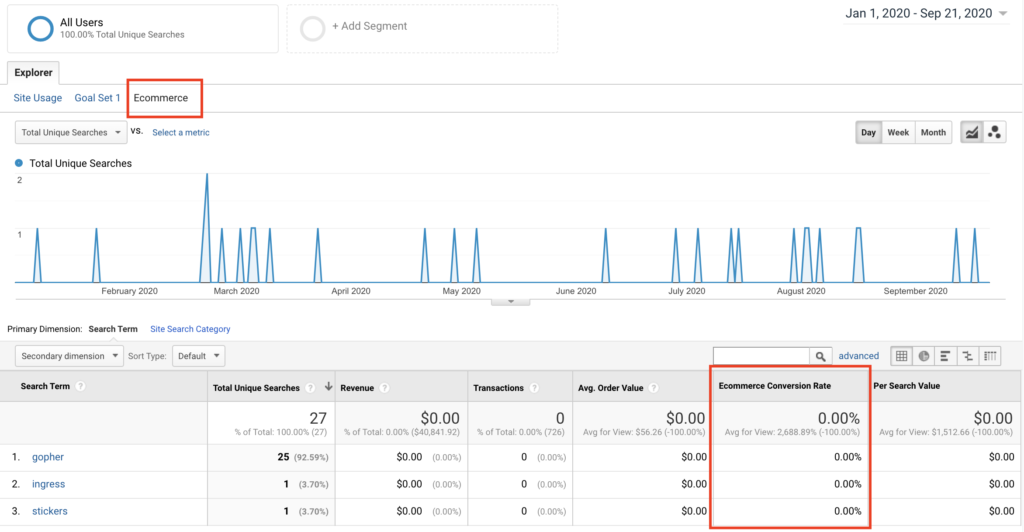
When you click the Ecommerce explorer option, you can see the words through which users made purchases.

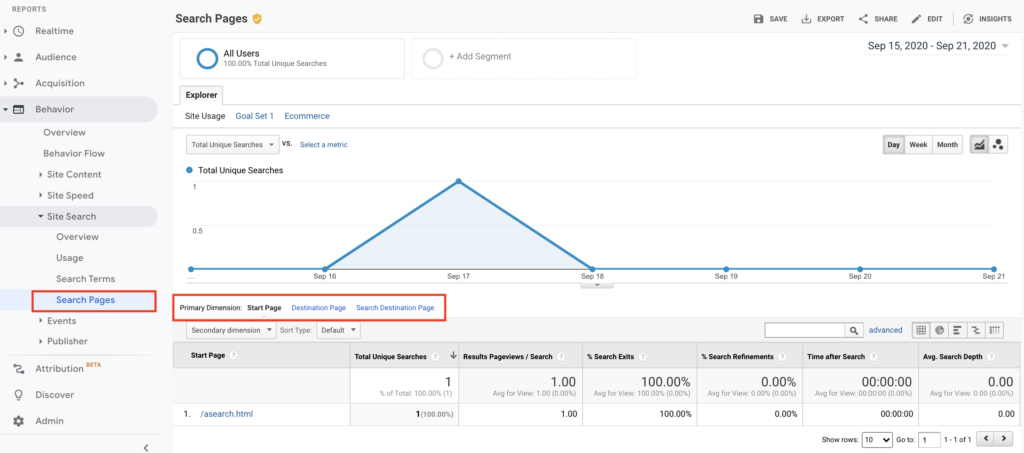
And here are the start pages users searched for in this view: 

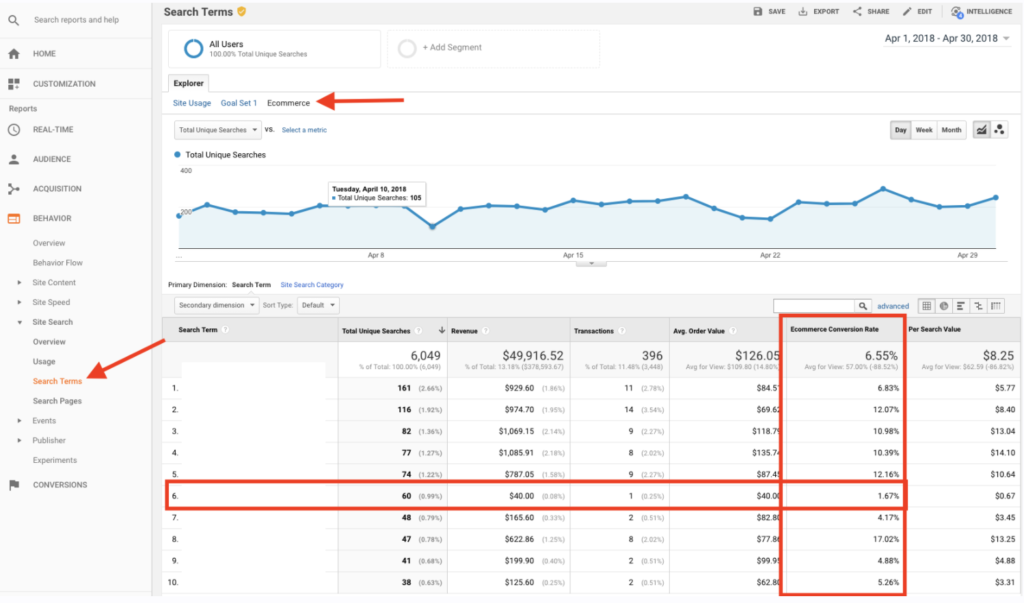
To get search trends, select “Search Terms” in the “Site Search” section and see all the actual words that are searched via your search field on your website.

Now here are the two things that I like to do in this step:

1. Select the “start page” as a secondary dimension. Now you can see the page visitors started searching.

2. Select “Exit Page” as a secondary dimension.

I know that if users leave the search results page, they cannot find what they actually need.

Gotcha!

There are two search terms that you can see who searched for something but just couldn’t find it. 🤔

Bonus action: 

  • Please try this on your own search bar on your website first.
  • If it’s a product or a category based keyword, then you can redirect this query directly to the relevant page. It’s a good start hah? 🙂
  • Decrease your interaction cost, suggest related searches, or auto-complete search queries to get better results.
  • Since you know that the data as your users’ pain point here is important for your users, you can use it both in your campaigns and in your SEO operations.

2. Product performance

You’ve achieved the dirty work of improved e-commerce up and running in Google Analytics. Now it’s time to take some action.

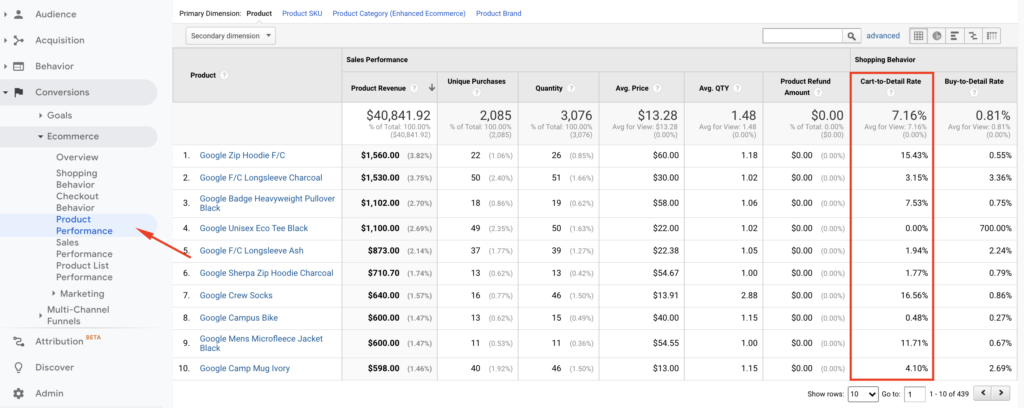
Whether you’re driving visitors to product pages via buying campaigns, retargeting, or some promotions on site, one of the most critical metrics is the percentage of add to cart actions. We call it “Cart-to-Detail Rate”.

Here is the quick way to see it in Google Analytics:
Conversions > Product Performance > and then click on the Shopping Behavior explorer option.

Bonus action: It will be useful to look at the products that fall below the average.
In the example above, although it is the eighth product with the highest revenue, we can see that the related product has a 0.48% Cart-to-Detail Rate.

OK. What should I do from here?

  1. Do you still have this product in stock? It may be helpful to check.
  2. Are there any major pricing issues, missing pictures, or description details?
  3. Bad reviews or minimal content around the product?
  4. When you check the page, what do you think could cause this result?

If you aren’t certain then on the minimal you may think to pause your campaign budget for this web page till you can develop a hypothesis around “why” that is appearing so poorly.

3. Email time of day performance

This insight will show you how to visualize sessions and transactions out of your emails.

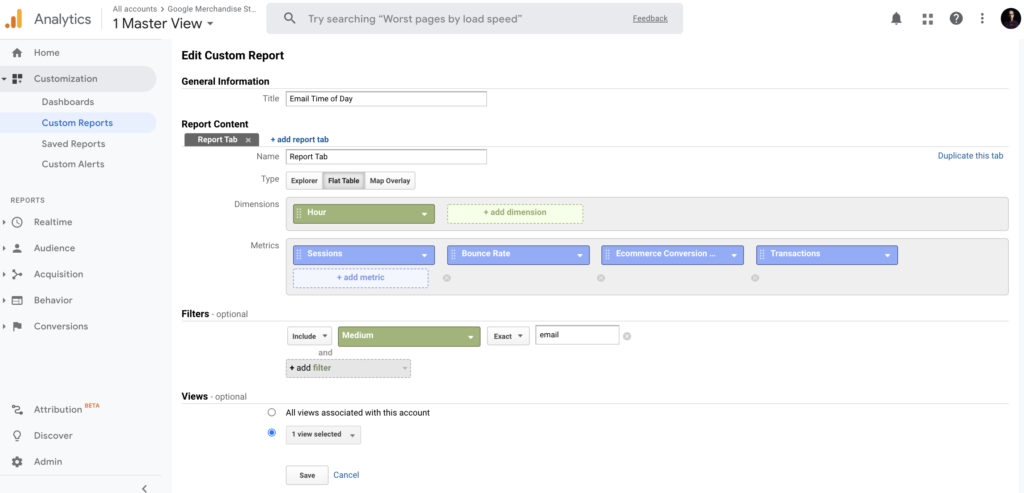
Now please go to, In Google Analytics > Customization > Custom Reports > Create New Custom Report with the following settings:

You will see the report saved as below.

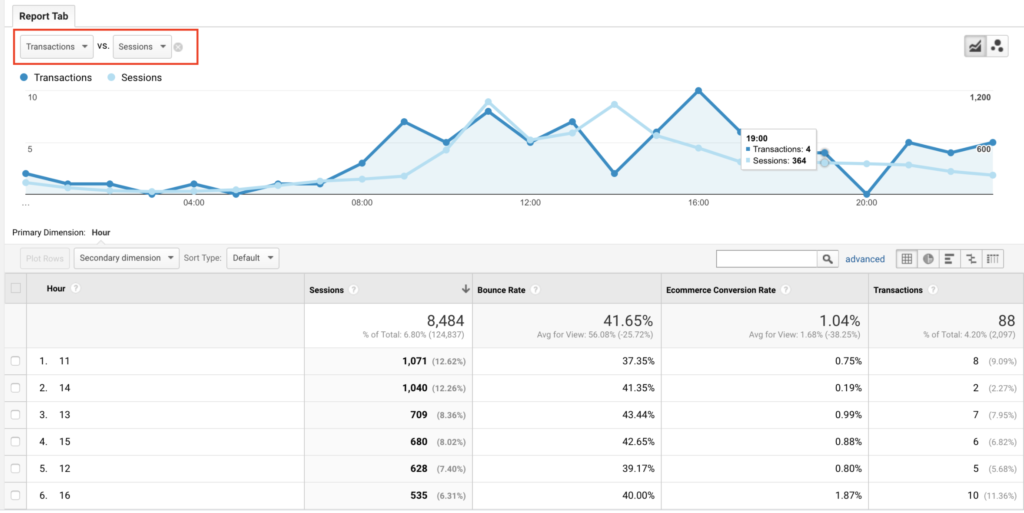
Also, you need to add sessions and transactions into your explorer tab shown in red:

The data shown over the 24 hour span of on a daily basis rolled up for the complete date range period. And you might have the table breakdown below the graph.

Insight action: How can you use this insight to your business?

  1. What is your average amount of time between send and opened mails? If a large percentage is opened within the first hour, you can try optimizing your emails for that time plan.
  2. What is your average amount of time between send and opened mails?
    If a large percentage is opened within the first hour, you can try optimizing your emails for that time plan.

4. Top converting content to improve internal linking 

Following the last few steps will help you identify the most popular way people are arriving at your site and navigating through. Executing these steps will help you capitalize on getting more visitors. 

The next logical insight is to effectively funnel this traffic into your primary goals or objectives to move your business metrics. 
And thank God, there’s a simple report buried deep that can help you connect these dots: 

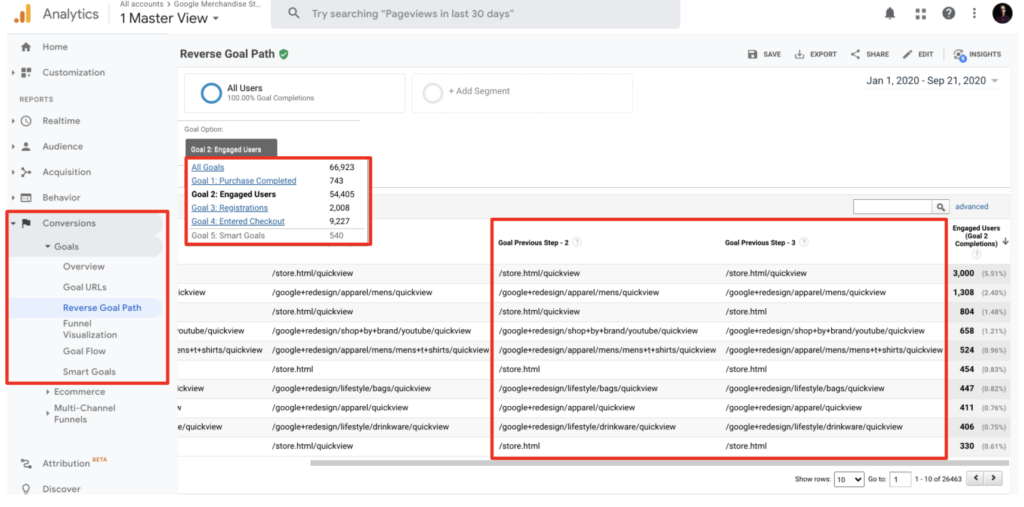
  1. Go to your Goals > Reverse Goal Path section which is under the Conversions.
  2. Select the primary goal you’d like to view or analyze in this view.

Abra Kadabra: Now you’ll be able to see the previous pages people used before accomplishing your goal in your website. These show the pages your users were on before your goal converted.

Insight Action: You should lead the rest of your visitors from your popular pages to the pages that you’ve discovered which have the highest conversion numbers based on the primary action that you see.

5. Behavior flow

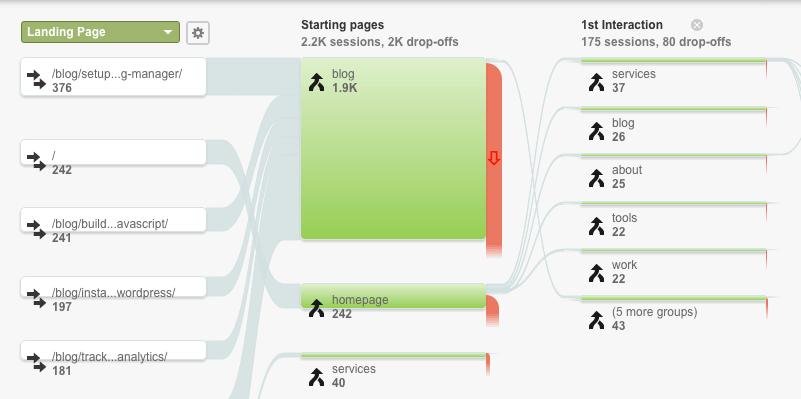
Behavior flow is a good resource to show your visitors’ moves on the website and where they went next. The report visualization is helpful for landing page optimization and to verify that your audience is viewing the best possible content.

And here’s what I like to do:

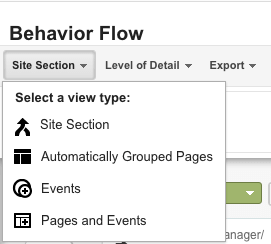
  1. On the top left corner of the Behavior Flow Reports, you can “Select a view type” and see the user flow according to content grouping, automatically grouped pages, events, or according to both pages & events.
  2. Let’s find out what each of the view types tells us.

Content grouping is a feature of Google Analytics that helps you to arrange your pages into specific segments so you can evaluate metrics aggregated under each group.

To see your content groups in your flow you need to first create your content grouping in your GA account.

Here is the quick way: admin >> view >> content grouping.

When you select “content grouping” in view type, the Behavior Flow Reports will show you a flow user navigates according to the content group you selected.

Conclusion

UX analytics is the first part of design-driven development. Sorry but it’s true, this is the first way to get more users to understand your users’ problems before running your ad campaigns. For this, you should first assign a meaning to your data and organize the things you see missing. Because raw data is meaningless. However, with this blog post —which you can access in 10 minutes— you can understand your users’ problems and create a more comfortable conversion path for them.

In our experience at SHERPA, many organizations do not have the ability to interpret the information they see in Google Analytics. Hope this content helps you develop insights based on your users’ footprints.

And best of all, all these insights are data-driven.