Before reading this post, if you didn’t have the chance to take a look at 5 Smart Google Analytics Tips to Improve User Experience about tracking users in your digital product via Google Analytics, now is the time to go.
There are many ways to understand user behaviour and how they react when they’re interacting with the web interfaces. Google has come a long way so far with GA4 that it has just launched to the professionals. It is still one of the best free tools you can use to conduct quantitative user research to get in-depth insights today.
Today we know that considering a website design as “just a website design” is easy.
So is that right?
Work goes even deeper when user experience is included.
While it is said that the most important metric for a website is the conversion rate, if your users don’t have great experiences interacting via mobile phones or desktop devices, unfortunately, you can’t have the conversions that you expect.
This means that a UX design team needs to know what users are doing in their products. It is necessary to know where the target audience comes from, how long they stay in the product, and how they can improve conversions.
So let’s look at what you can learn from Google Analytics as a UX designer before starting a design project, and how you can form a basis for the user experience.
Major Benefits of Google Analytics for UX Design
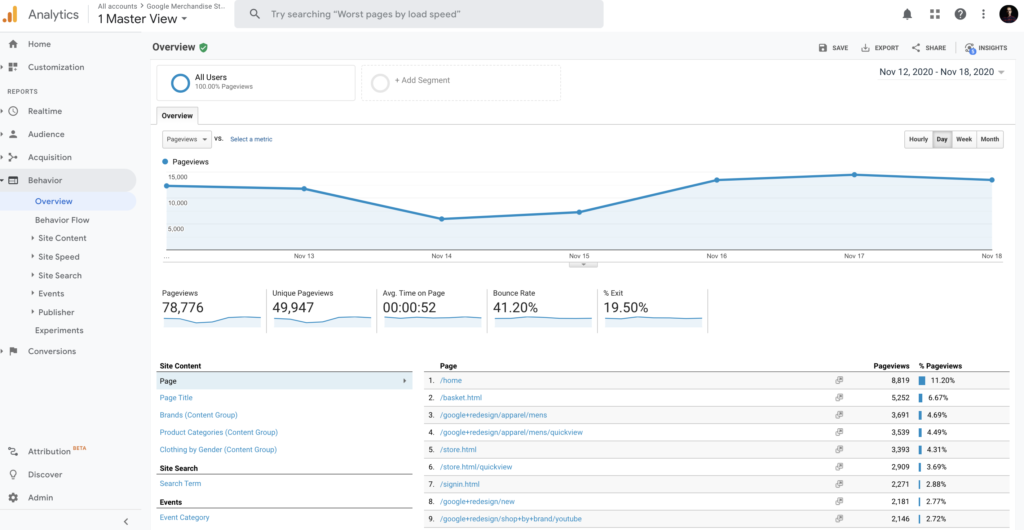
Any digital product has multiple metrics to track in order to improve the user experience. However, Google Analytics can open a door to improve how a digital product performs from the moment a user lands on a webpage to the moment they leave.
The action-based information obtained here will help optimize the user experience of the website.
Here is the first one:
Your audience, your power.

This report is perhaps one of the most useful pieces of data user experience designers can get. It gives you a crystal-clear snapshot of who your target audience really is.
So, how does the target audience data you get here help user experience designers? Here are a few quick tips:
Location:
If you are getting enough session volume to your website from different countries, you may want to consider adding a second language to your site. This way, your website has a chance to welcome users from that region in their native language.
Time of Day:
For instance, if you’ve observed that your website visitors mostly visit at midnight, you can also run a night mode for your website, as Reddit did before.
Browser & OS:
For example, you can view the browsers of users who visit your website in this area. You can examine the performance of metrics such as the bounce rate, average session duration, goal completion in Google Analytics for browsers. This way, you can analyze the type of browser users have, and how well they experience your website through it. If there is a result that surprises you, it may be useful to focus on this area in a design.
Something wrong with your speed?

2020. What a year. History is happening around us, and Google? Well, Google keeps on revamping to focus on real user experience in the product. But this time it’s a little different. Google also made it clear this year that the site owners care about the speed experiences of their pages. Besides this boiling point, the company has taken the business so far that it announced that it has added the page experience offered by its websites as a ranking factor as Core Web Vitals.
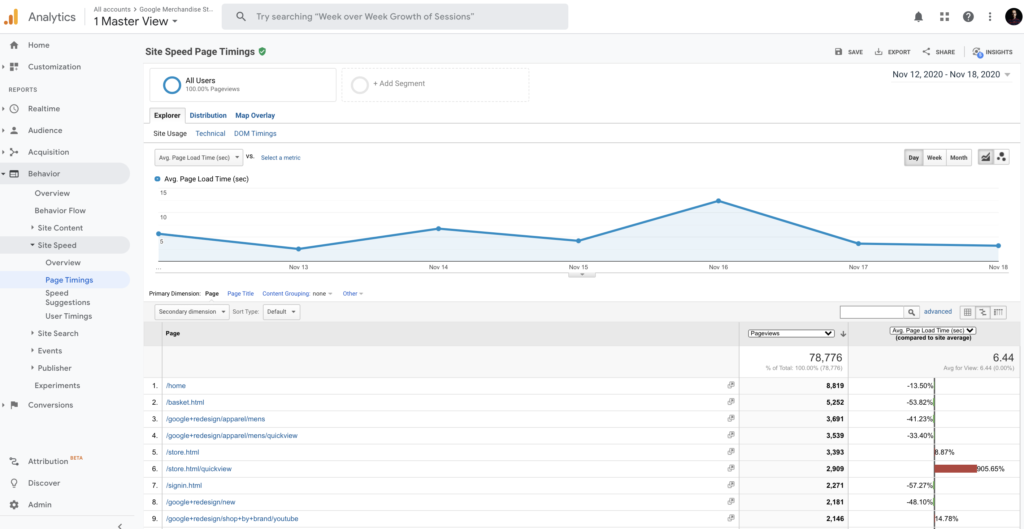
Page Timings
If there is a negative situation above the average from the pages on your site, you can get a report through Page Timings via Google Analytics. The density of the CSS codes used on the page or the visual solutions you use in the design may have slowed your website unintentionally. Google Analytics here also offers website administrators their own advice.
Where do users go after landing on your homepage?

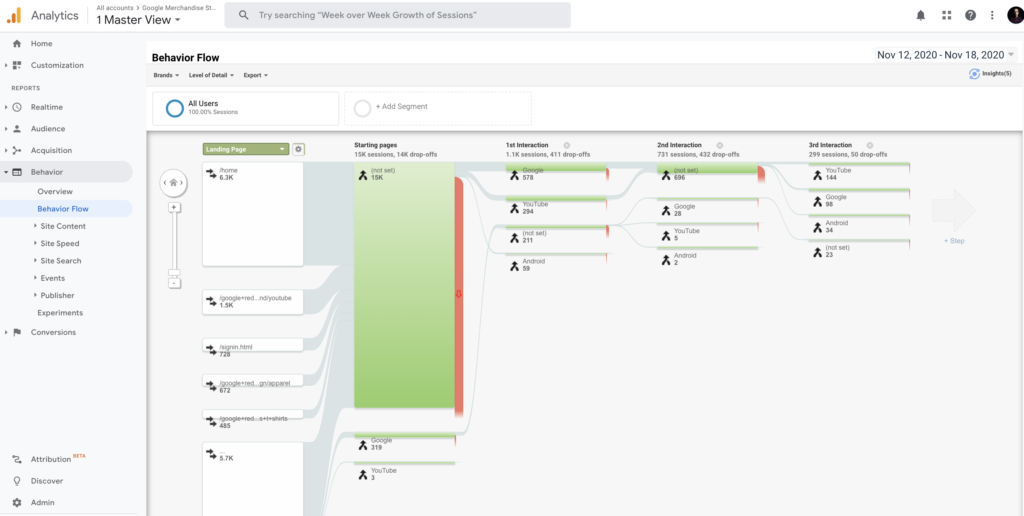
A behavior flow is a report of your users’ journeys from the moment they enter your website.
The behavior flow simply answers your questions below.
- Where do your users visit after the home page?
- Which links do they show interest in?
- Have the same users visited again?
- Where did your users spend the most time on the website?
Behavior Flow helps identify the pages that bring you the highest traffic volume while providing you with insight into where your users drop off the most. This way, it helps designers to optimize the user experience in order to make the user’s journey more comfortable.
New vs. Returning Visitors

SHERPA knows very well to measure humans’ reactions rather than clicks, which often means a departure from more than Google Analytics. However, we love to take advantage of the power of analytical tools to define our way to improve user experience.
One of the indicators of how much users enjoy their experience within the product that will meet the expectations of the product offered to the users is the improvement in retention.
Looking at the behavior of these two segments tells useful insights into the content, structure, and design of your website. And it can reveal better approaches to providing value to your audience through new vs returning visitors’ reactions and interaction points in the interface.
In conclusion, rather than creating a design based entirely on instincts and assumptions, I have to say that our greatest strength lies in our decisions based on rational data.
And Google Analytics, though usually associated with marketers, is a treasure trove for designers.
According to the metrics above, progressing in the design processes will also strengthen your rational decision-making direction.
It is a pleasure for me to share our favorite feature of SHERPA with you.
At the end of the day, it is all data driven.
