About the project
The design process that we started with Sportive, from user definitions to product categorization and a brand new interface, successfully ended with achieving key project goals such as increasing the mobile conversion rates, the shopping cart conversion rates, and the share of season products in total sales.
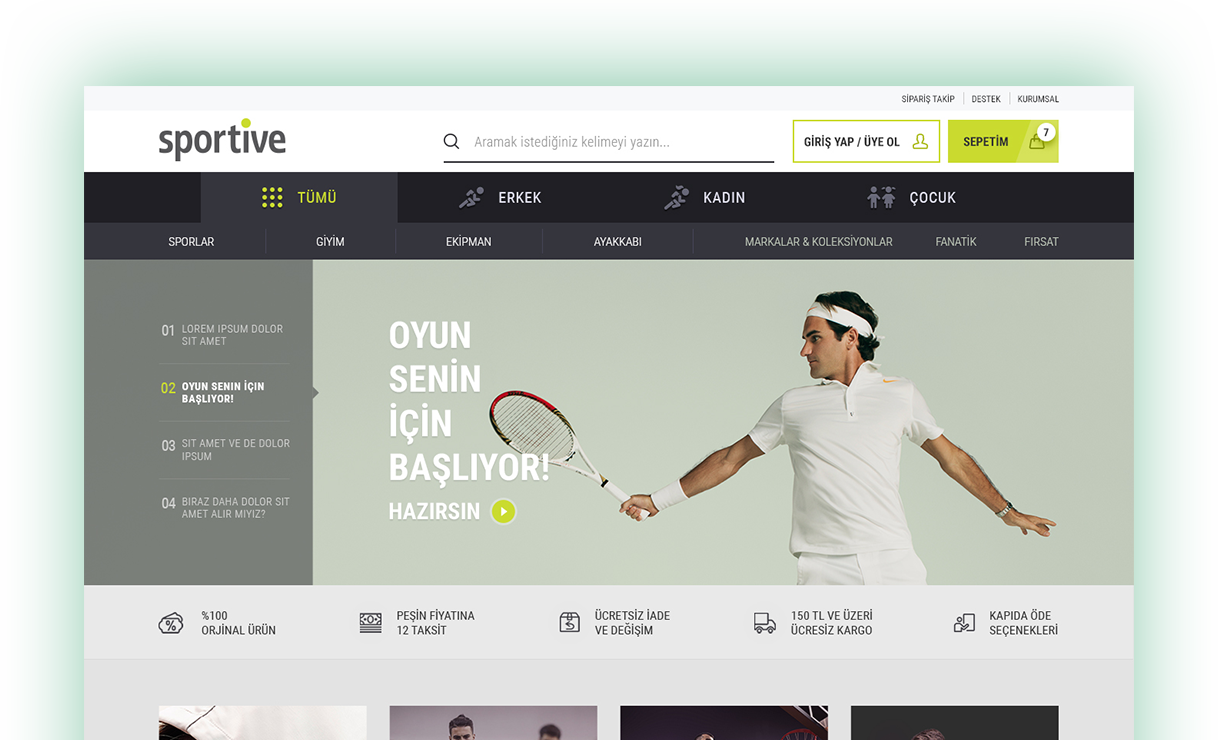
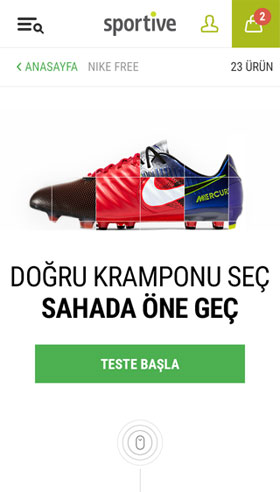
Sportive, Turkey's leading sporting goods retailer, also a supplier of many sports clubs from different branches; presents the world-famous sports brands to their customers in 36 retail stores in 11 cities also in their online store. The Sportive team, which we started to work on in the renewal process of the online store of the brand, first asked us to analyze their desktop website’s interface design in terms of user experience and then re-evaluate them from scratch according to the obtained information and the visual brand identity of Sportive.
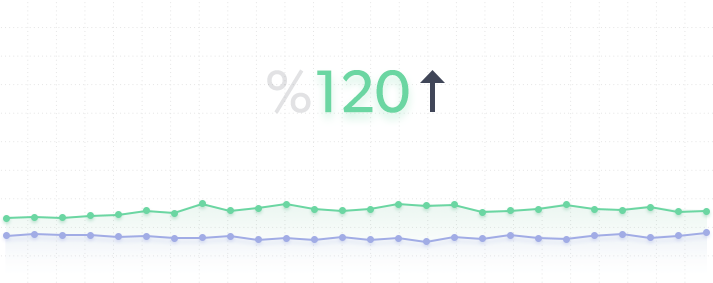
We started with user research to better understand and verify brand's business goals and customer profile, then we optimized the product categorization and the website navigation, finally we designed the brand new user interface. In the 6 month period over the publication of the new interface; the project goals, mobile e-commerce conversion rates increased by 20%, the shopping cart conversion rates increased by 120%, while mobile revenues increased by 55% compared to the data of the same period of the past year.
Our services
USER EXPERIENCE ANALYSIS
- UXAAR! - UX Analytics Audit Report
- Usability Analysis
CONTENT STRATEGY AND INFORMATION ARCHITECTURE
- Content Creation and Editing
- Content Map Creation
- Category Tree Building & Card Sorting
USER EXPERIENCE STRATEGY AND
DESIGN
- Persona identification
- User Journey Design
- Lo-Fidelity Wireframe Design
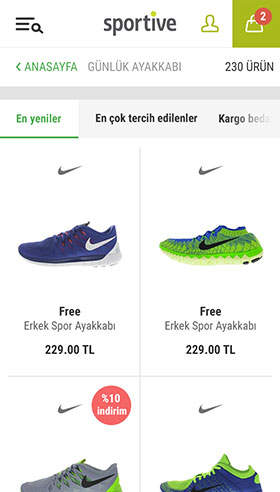
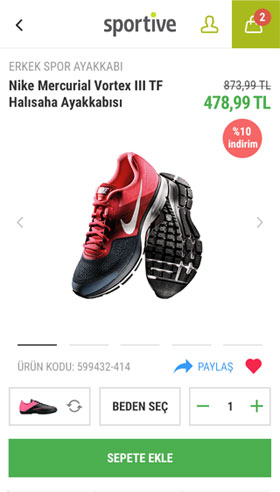
- User Interface Design
CONVERSION OPTIMIZATION
- Identification of Special Performance Indicators
- Custom Measurement Systems Setup & Optimization
- Conversion-Focused Hypothesis Development
Getting to know the users better
Identifying the Sportive online store was the first priority for the brand, their business partners and for us.
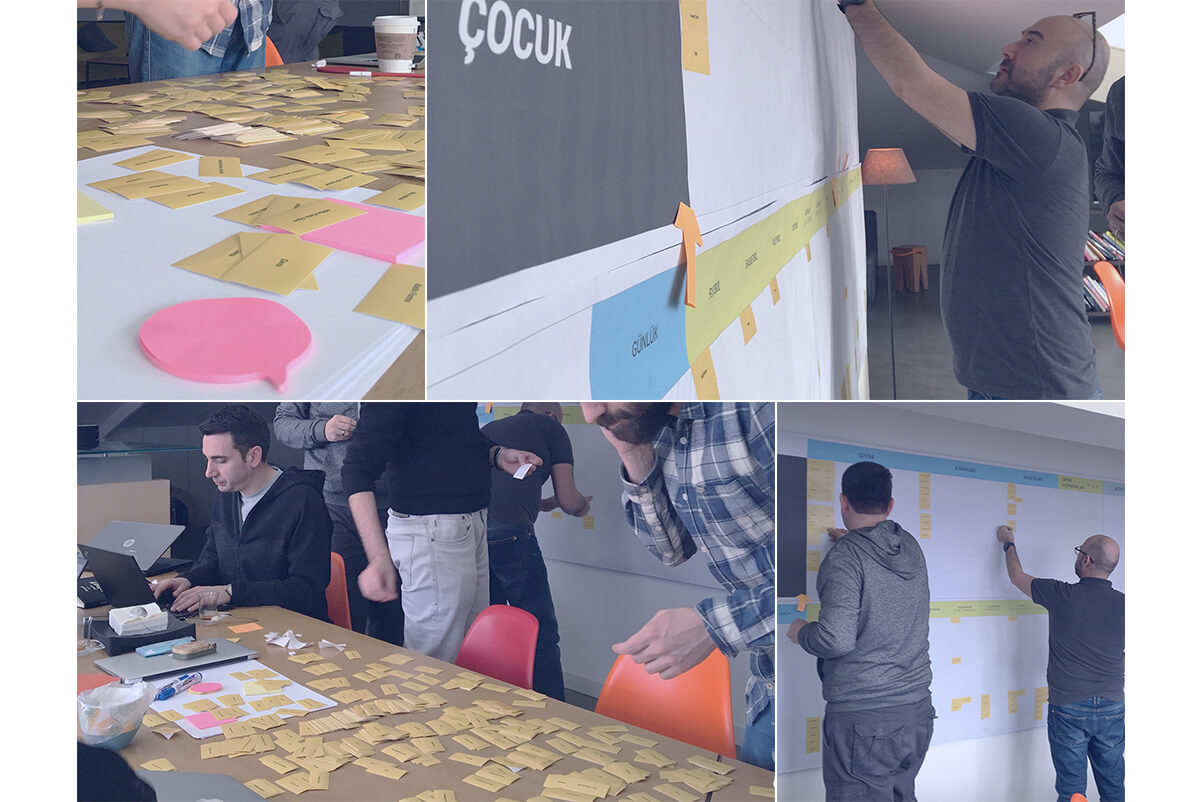
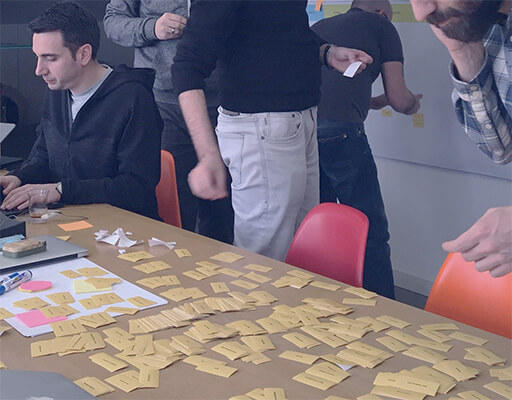
That's why we have done a persona workshop with Sportive team. At the beginning of the workshop, we obtained insights by examining the long term website analytics data in detail and presented them as a source to the participants for creating potential personas.
The characteristics that the brand identifies according to their customer interaction experiences have greatly influenced the personas. When we have completed these by matching them with the analytics data, many different user profiles have been created. We grouped similar ones among them, and we prioritized some with consensus.
The customer’s
contact with the brand
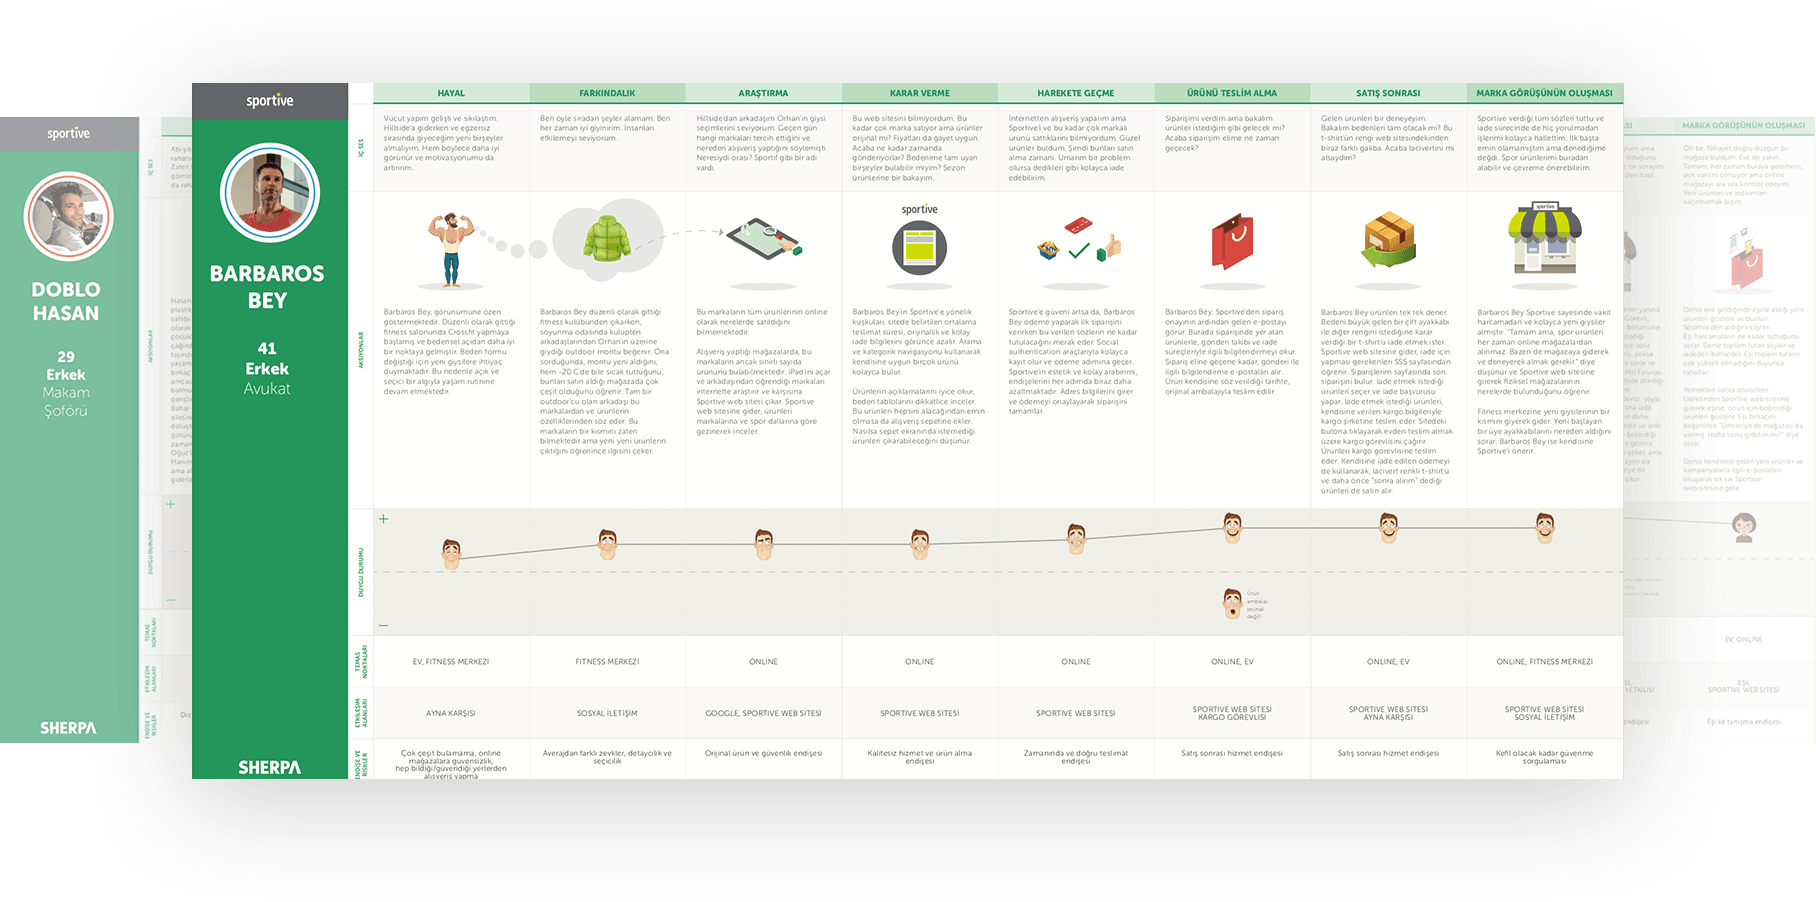
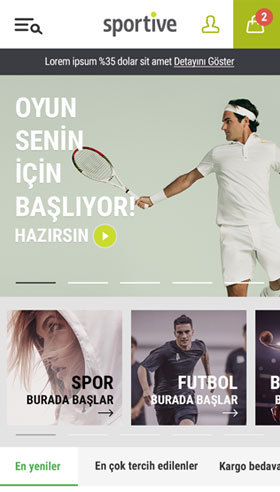
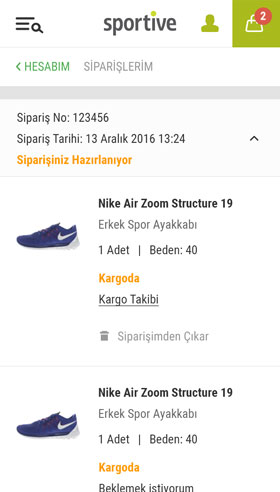
In the next step, we created customer experience journey maps for the personas which we created at the workshop. We created stories about the interaction of customers at all the touchpoints of the brand, especially at the Sportive online store. In this storytelling, we evaluated feedback from real customers matching their personal experiences at specific touchpoints.
And then we started designing the interactions of the users in different parts of the online store, in the context of the data on the customer experience journey maps.
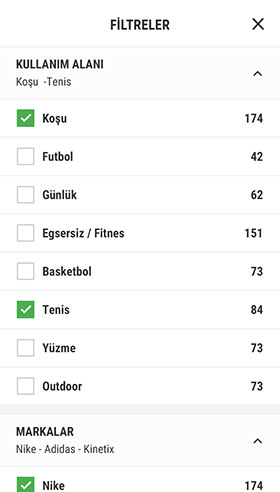
Categorization and navigation
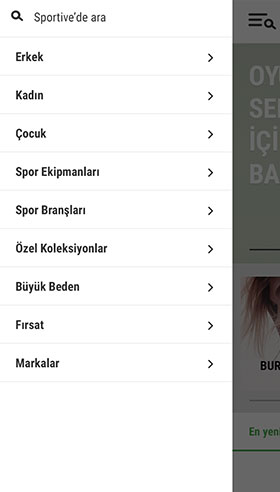
The categorization of the departments in the Sportive online store; which has footwear, athletic wear, as well as sporting equipment and accessories in more than 20 sports branches, was very important for the customer experience. It was one of our key tasks to create this categorization and present it in an understandable and accessible menu for the users.
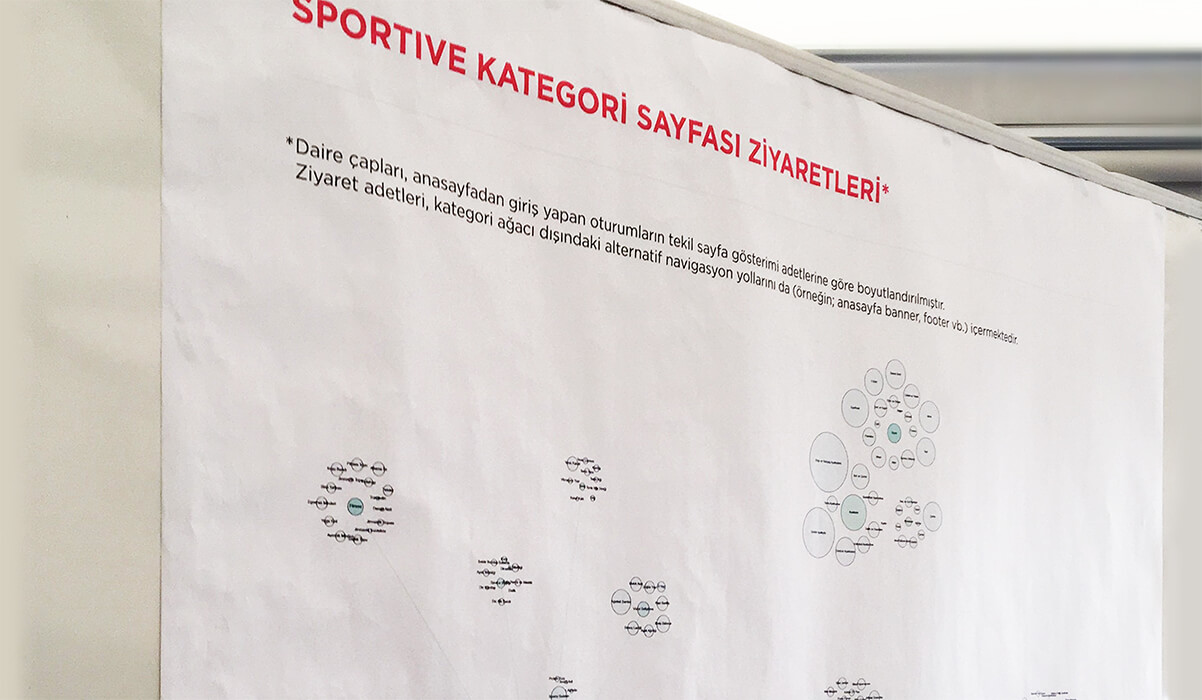
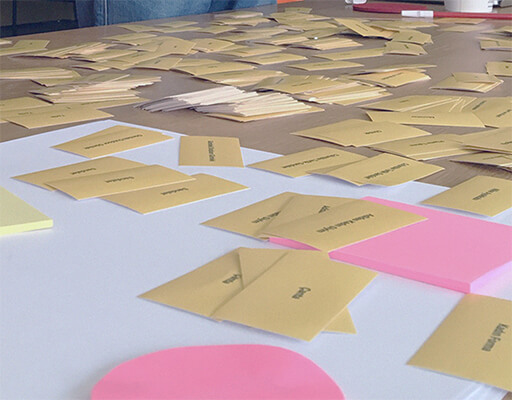
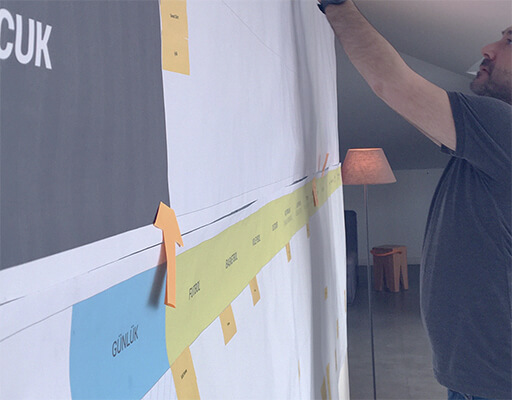
With the card sorting workshop, we have done with Sportive team, we have put the basic stones of the categorization in place. The practice of grouping the cards, which all the products in the store are written on, by relation rate gave us the opportunity to confirm our ideas and to get new ideas of categorization.
We were able to build the categories and navigation of the online store with our simultaneous research, comparison with the best practices and multi-faceted exchange of ideas.
Flows and tests
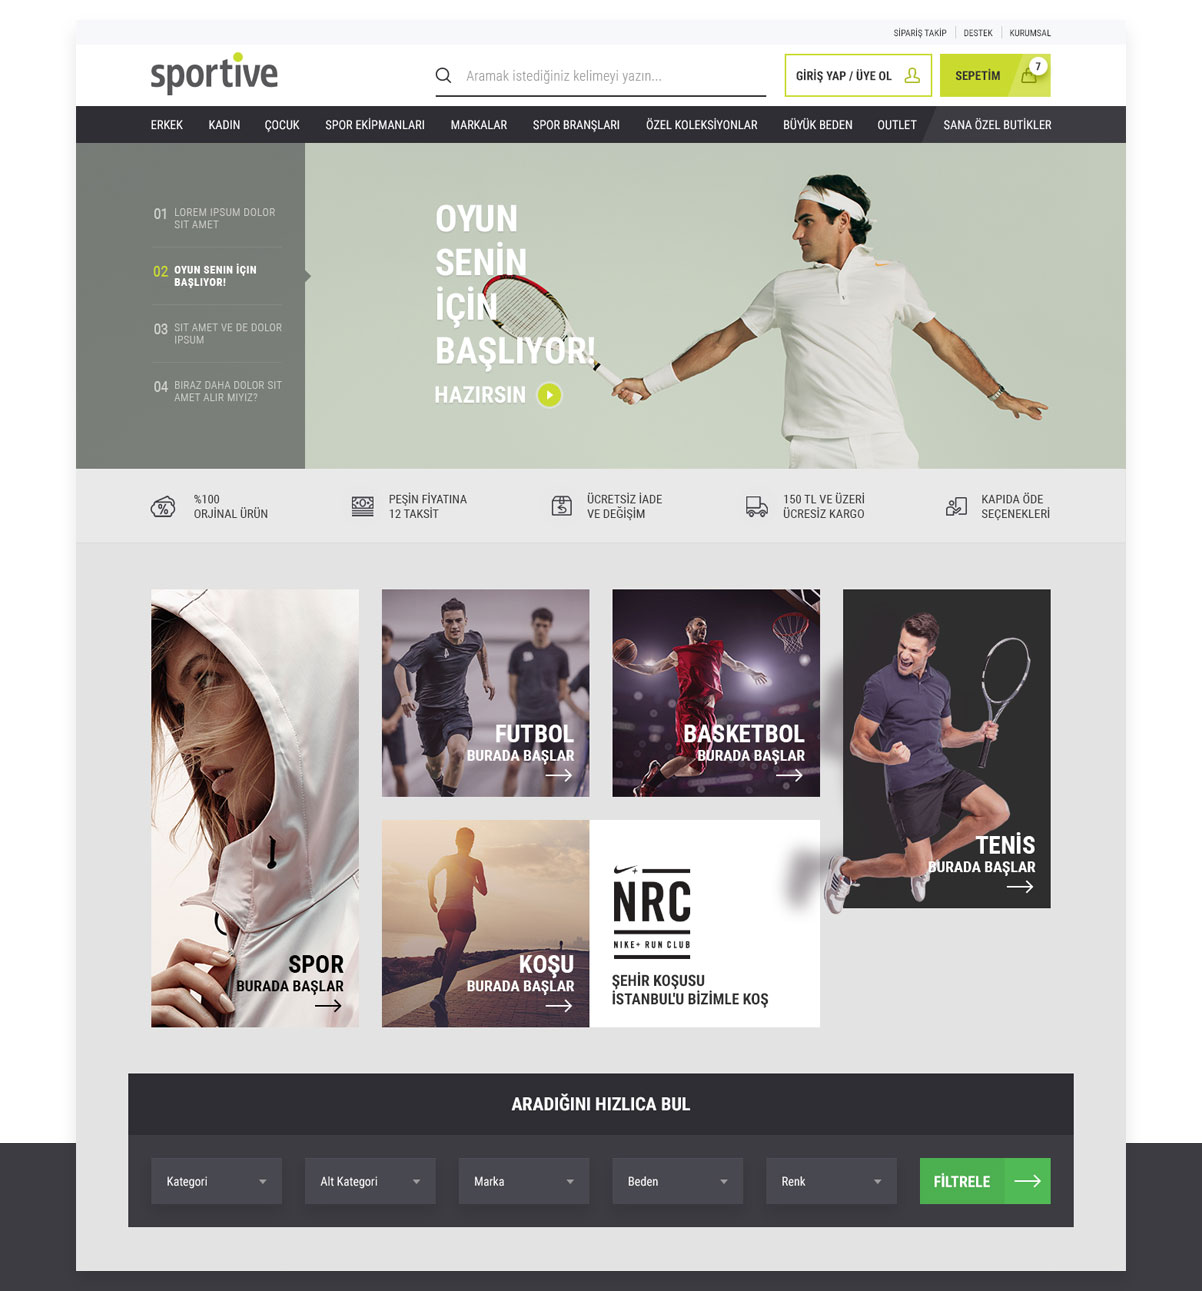
At the interface design phase, the priority was updating the existing designs on the basis of basic user experience practices. While doing these updates, we saw the lack of some of the flows in the customer experience processes.

We created these flows and then we moved on to the design phase. At the design phase; we did analytics based analyses, considered the comments of the Sportive team, developed hypothesis where necessary and came up with the ideal solutions by testing.
Goal: Mobile conversion
The positive results of our new interface design, which we supported based on our research, started to emerge soon. Among the objectives of the Sportive team was to increase mobile conversions and increase the share of seasonal products in total sales.
| Bounce rate (%) | E-commerce conversion rate (%) |
Conversion growth rate (%) |
Revenue percentage change (%) |
|---|---|---|---|
| 0,49 | 0,64 | - | - |
| 0,47 | 0,77 | 20 | 55,32 |
Before
After
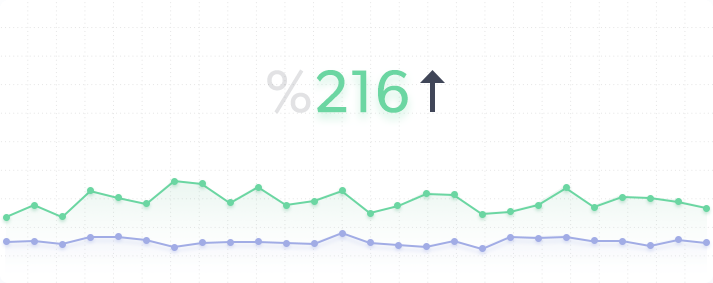
In the 6 month period over the publication of the new interface (October 1, 2017 - March 1, 2018) mobile conversion rates increased from 0,64% to 0.77% over the same period of the last year (October 1, 2016 - March 1, 2017).
This change was reflected in an increase of around 55% in mobile revenues.
| Season revenue (%) | Outlet revenue (%) |
|---|---|
| 0,16 | 0,84 |
| 0,27 | 0,73 |
Sonraki
Önceki
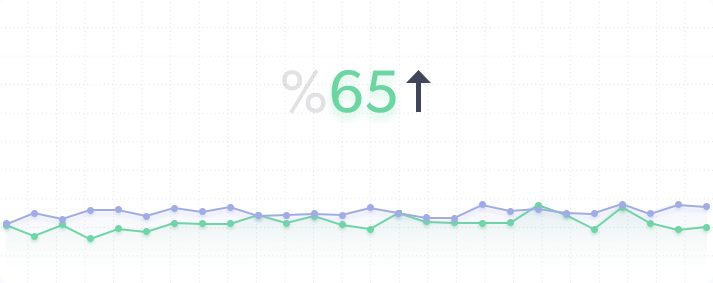
Again, when the pre-design and post-design periods are compared, it was observed that the share of seasonal products in all sales increased from 16% to 27% with an increase of approximately 37%.
As a result of the improved shopping experience, abandonment rates decreased by about 24% and the sale success increased by 120%.
1 October 2017 - 31 March 2018
1 October 2016 - 31 March 2017
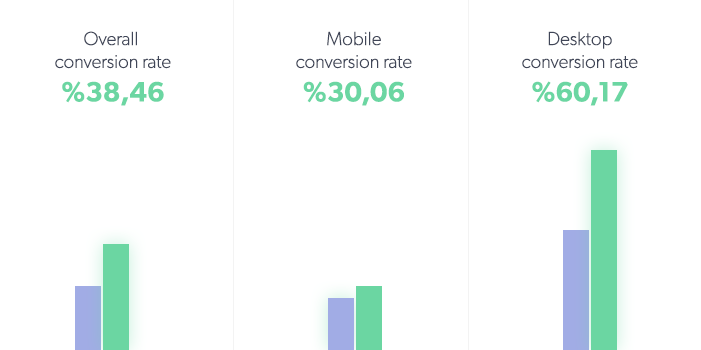
The conversion rates of paid search traffic rose up to 38% in general, 30% on mobile and 60% on desktop.
Paid search
1 October 2017 - 31 March 2018
1 October 2016 - 31 March 2017
1 October 2017 - 31 March 2018
1 October 2016 - 31 March 2017
Sustainability
While the Sportive online store went on renovating gradually, the brand's evolving business goals and user expectations that emerge along with the innovative ideas also kept the experience design process alive. The innovative mentality and the high energy of the Sportive team had been the most important supporters of our success in this project.

Umur Korkut
Sportive | E-Commerce and Digital Marketing Manager
A very versed road partner, SHERPA understands that the needs of the companies, which have difficulties in the path of institutionalization also experience polyphony, time problems, and chaos, change continuously along the way; and determines the most accurate targets with the data they have received from you and the methodologies they have developed accordingly.
SHERPA has a rare-to-find yet easy-to-understand team, which I’m pretty sure every member of it remind themselves the fact “all the statements that were not analyzed and measured, untested, briefly not based on the verse, are just statements” first thing in the morning; working in an office on the top floor of a building, just like the team doing their job at the top level.
With SHERPA, analysis, strategy and design processes operate in a similar way to the clockwork mechanism. There are no delays in all the work done and the reports you receive; the error margin is close to zero. SHERPA is “guide” and “timing” beyond the word meaning. You can consult along the way you work, learn continuously and get results quickly.
It may sound interesting to hear and say but; you can proudly write that you worked with SHERPA in your resume.
PS: There are some points not included in the SHERPA Playbook. The most important one to know: SHERPA can surprise you by knowing you better than yourself. Just smile, sit back and enjoy working with SHERPA.